The Republic of Northern Africa Pelican
Things explode
Region: Suspicious
Quicksearch Query: Northern Africa Pelican
|
Quicksearch: | |
NS Economy Mobile Home |
Regions Search |
Northern Africa Pelican NS Page |
|
| GDP Leaders | Export Leaders | Interesting Places BIG Populations | Most Worked | | Militaristic States | Police States | |

Things explode
Region: Suspicious
Quicksearch Query: Northern Africa Pelican
| Northern Africa Pelican Domestic Statistics | |||
|---|---|---|---|
| Government Category: | Republic | ||
| Government Priority: | Religion & Spirituality | ||
| Economic Rating: | Weak | ||
| Civil Rights Rating: | Some | ||
| Political Freedoms: | Few | ||
| Income Tax Rate: | 44% | ||
| Consumer Confidence Rate: | 96% | ||
| Worker Enthusiasm Rate: | 95% | ||
| Major Industry: | Beef-Based Agriculture | ||
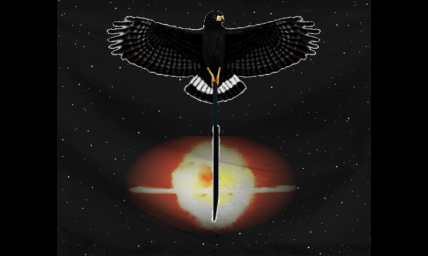
| National Animal: | hawk | ||
| Northern Africa Pelican Demographics | |||
| Total Population: | 5,354,000,000 | ||
| Criminals: | 645,454,033 | ||
| Elderly, Disabled, & Retirees: | 662,001,177 | ||
| Military & Reserves: ? | 160,947,080 | ||
| Students and Youth: | 950,870,400 | ||
| Unemployed but Able: | 860,298,283 | ||
| Working Class: | 2,074,429,028 | ||
| Northern Africa Pelican Government Budget Details | |||
| Government Budget: | $5,038,569,340,849.36 | ||
| Government Expenditures: | $4,635,483,793,581.41 | ||
| Goverment Waste: | $403,085,547,267.95 | ||
| Goverment Efficiency: | 92% | ||
| Northern Africa Pelican Government Spending Breakdown: | |||
| Administration: | $370,838,703,486.51 | 8% | |
| Social Welfare: | $417,193,541,422.33 | 9% | |
| Healthcare: | $417,193,541,422.33 | 9% | |
| Education: | $370,838,703,486.51 | 8% | |
| Religion & Spirituality: | $788,032,244,908.84 | 17% | |
| Defense: | $556,258,055,229.77 | 12% | |
| Law & Order: | $602,612,893,165.58 | 13% | |
| Commerce: | $185,419,351,743.26 | 4% | |
| Public Transport: | $370,838,703,486.51 | 8% | |
| The Environment: | $185,419,351,743.26 | 4% | |
| Social Equality: | $231,774,189,679.07 | 5% | |
| Northern Africa PelicanWhite Market Economic Statistics ? | |||
| Gross Domestic Product: | $3,769,200,000,000.00 | ||
| GDP Per Capita: | $704.00 | ||
| Average Salary Per Employee: | $1,077.11 | ||
| Unemployment Rate: | 25.44% | ||
| Consumption: | $5,479,151,855,206.40 | ||
| Exports: | $1,311,783,744,000.00 | ||
| Imports: | $1,317,058,379,776.00 | ||
| Trade Net: | -5,274,635,776.00 | ||
| Northern Africa Pelican Non Market Statistics ? Evasion, Black Market, Barter & Crime | |||
| Black & Grey Markets Combined: | $14,094,050,556,491.41 | ||
| Avg Annual Criminal's Income / Savings: ? | $1,733.01 | ||
| Recovered Product + Fines & Fees: | $1,374,169,929,257.91 | ||
| Black Market & Non Monetary Trade: | |||
| Guns & Weapons: | $589,089,471,548.75 | ||
| Drugs and Pharmaceuticals: | $779,410,685,433.73 | ||
| Extortion & Blackmail: | $435,019,917,451.39 | ||
| Counterfeit Goods: | $833,788,175,115.16 | ||
| Trafficking & Intl Sales: | $670,655,706,070.89 | ||
| Theft & Disappearance: | $507,523,237,026.62 | ||
| Counterfeit Currency & Instruments : | $978,794,814,265.62 | ||
| Illegal Mining, Logging, and Hunting : | $290,013,278,300.92 | ||
| Basic Necessitites : | $561,900,726,708.04 | ||
| School Loan Fraud : | $362,516,597,876.16 | ||
| Tax Evasion + Barter Trade : | $6,060,441,739,291.31 | ||
| Northern Africa Pelican Total Market Statistics ? | |||
| National Currency: | rubledollar | ||
| Exchange Rates: | 1 rubledollar = $0.06 | ||
| $1 = 16.94 rubledollars | |||
| Regional Exchange Rates | |||
| Gross Domestic Product: | $3,769,200,000,000.00 - 21% | ||
| Black & Grey Markets Combined: | $14,094,050,556,491.41 - 79% | ||
| Real Total Economy: | $17,863,250,556,491.41 | ||
| Suspicious Economic Statistics & Links | |||
| Gross Regional Product: | $336,902,560,457,687,040 | ||
| Region Wide Imports: | $45,169,080,130,338,816 | ||
| Largest Regional GDP: | Sparkdottir | ||
| Largest Regional Importer: | Sparkdottir | ||
| Regional Search Functions: | All Suspicious Nations. | ||
| Regional Nations by GDP | Regional Trading Leaders | |||
| Regional Exchange Rates | WA Members | |||
| Returns to standard Version: | FAQ | About | About | 483,375,042 uses since September 1, 2011. | |
Version 3.69 HTML4. V 0.7 is HTML1. |
Like our Calculator? Tell your friends for us... |